Monitoring and Support

For subscription platforms and hosting environments, continuous monitoring eliminates guesswork and ensures unwavering reliability. Exclusive reliance on Amazon CloudWatch alongside the complete AWS observability suite provides comprehensive, real-time visibility into every layer of infrastructure and applications. This proactive approach detects anomalies before they affect users, automatically triggers resolutions, and maintains peak performance across complex, high-traffic deployments.
CloudWatch: Full-Stack Observability Foundation
Amazon CloudWatch stands as the unified monitoring platform, ingesting billions of data points daily from AWS services, on-premises systems, and custom applications. Its serverless design eliminates scaling concerns, automatically handling spikes in monitoring needs during traffic surges common to subscription services.
Key capabilities powering comprehensive coverage:
- High-Resolution Metrics: Collects over 200 built-in metrics per service (EC2, RDS, Lambda, EKS, ElastiCache) plus unlimited custom metrics. 1-second granularity captures microsecond-level changes in CPU utilization, memory pressure, I/O throughput, and network packets—critical for hosting environments serving thousands of concurrent users.
- Advanced Log Management: CloudWatch Logs centralizes structured and unstructured logs from application servers, containers, databases, and load balancers. Logs Insights enables SQL-like queries across terabytes of data, extracting metrics from logs (like error rates from JSON payloads) and identifying patterns such as slow database queries or authentication failures.
- Distributed Tracing with X-Ray: Automatically instruments Node.js, Java, Python, and Go applications to create service maps showing request flows across Lambda functions, API Gateway, ECS tasks, and external APIs. Pinpoints exactly where latency accumulates—whether in database calls, third-party integrations, or container cold starts.
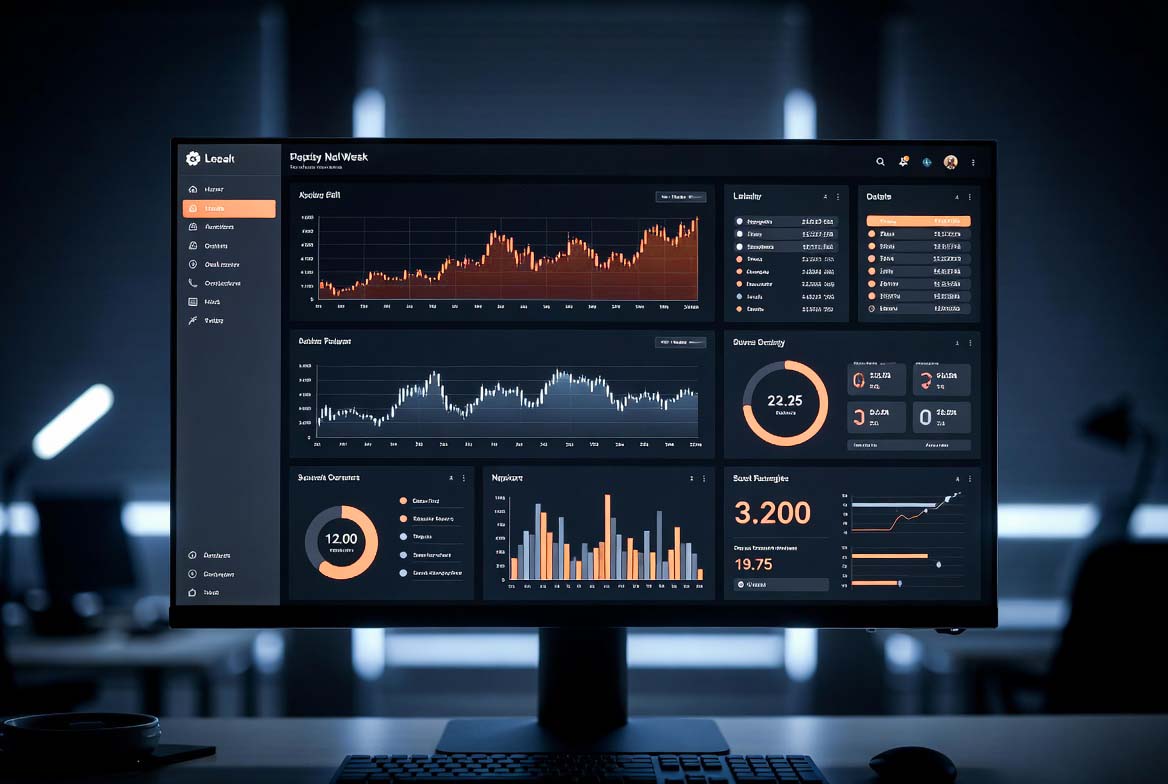
- Custom Dashboards and Widgets: Real-time visualizations combining line graphs, heatmaps, and gauges. Subscription platforms benefit from dashboards showing active subscribers, churn indicators from error spikes, and revenue-impacting slowdowns.
CloudWatch Alarms go beyond static thresholds with composite alarms (AND/OR logic across multiple metrics) and anomaly detection models trained on historical baselines. For hosting clients, this means alerts for unusual traffic patterns signaling viral content overloads, with false positive rates under 5%.
Proactive Performance Monitoring Suite
Layered monitoring catches degradation at every level:
- 15-Minute Accessibility Pings: CloudWatch Synthetics deploys headless Chrome canaries to ping every hosted site and critical endpoint every 15 minutes from multiple global locations. Tests verify HTTP/HTTPS status codes, DNS resolution, TLS certificate validity, and core page functionality. Instant alerts fire on 5xx errors, connection timeouts, or propagation delays—ensuring subscription portals and client sites remain accessible 24/7.
- End-to-End Synthetic Testing: Beyond pings, scripted canaries simulate complete user workflows: login sequences, checkout flows, content searches, and admin panel access. Measures Core Web Vitals (LCP, FID, CLS), API response times, and DOM load performance, alerting if page loads exceed 3 seconds.
- Application Signals and APM: New CloudWatch Application Signals automatically discovers and monitors services without agent installation. Delivers four golden signals—latency, traffic volume, error rates, saturation—plus AI-powered root cause analysis. For subscription apps, correlates slow dashboard renders to specific RDS slow queries or Redis cache misses.
- Infrastructure Optimization: AWS Compute Optimizer analyzes 14 days of usage to recommend EC2 instance families, EBS volume types, and Lambda memory allocations saving 20-40% on hosting costs. Trusted Advisor runs 50+ daily checks for performance risks like overutilized EBS volumes or unoptimized Auto Scaling groups.
Contributor Insights ranks top contributors to errors or latency (problematic Lambda functions, noisy RDS instances), prioritizing remediation efforts.
Intelligent Alerting, Automation, and Response
Monitoring transitions seamlessly to action:
- CloudWatch Events via EventBridge: Every alarm or synthetic failure routes to targeted responders. High-severity issues page on-call engineers via PagerDuty while triggering AWS Systems Manager Automation documents for auto-remediation.
- Automated Playbooks: Pre-built Lambda functions execute common fixes—increase Auto Scaling group capacity during CPU spikes, restart stalled ECS tasks, warm Lambda caches ahead of predictable traffic (daily subscription renewals), or rotate ElastiCache nodes showing memory leaks.
- Predictive Anomaly Detection: ML models establish "normal" baselines per metric, alerting on deviations ±2 standard deviations. Forecasts capacity needs 24-48 hours ahead based on subscription growth trends.
- Multi-Account, Cross-Region Visibility: CloudWatch Cross-Account Observability consolidates metrics from client-owned accounts into unified views, essential for managed hosting spanning dev/staging/production regions.
Tailored for Subscription and Hosting Workloads
Subscription platforms gain subscriber activity heatmaps correlating usage spikes to infrastructure strain. Hosting clients receive per-site monitoring granularity—individual WordPress installs, Node.js apps, or static S3 sites all tracked independently.
Mobile API endpoints get specialized monitoring for push notification delivery and auth token performance. Legacy hosting migrations benefit from side-by-side comparisons during cutover.
Guaranteed Reliability Through Intelligence
99.99%+ uptime emerges naturally from this stack: 15-minute pings eliminate unnoticed outages, proactive checks optimize before problems surface, and automation resolves routine issues autonomously. Existing subscription and hosting clients receive this monitoring layer standard—no add-ons required.
